
Test and Debug a Game
Follow a score from 0 to 2 in the Debugger, then inspect it while paused. Keep its starting state and message.
How the Parts Fit
Your saved project supplies the starting values and connected Logic; Debug Play starts a game with Debugger support. The Debugger observes that run’s messages, live instances and values. Restart from the saved project.
- Saved project
Save starting score 0 in the project file before you begin a fresh run.
run and activate
Live score: 2Debug Play starts the run. Set score to 2.
inspect
Observe the resultCompare the message with the watch, then pause to inspect the value in the running game.
- Repeat from 0
Stop and start again at 0.
Prerequisites
Use the working example from Saving and Loading Progress.
It has a Number Project Global named score, starting at 0, with interactions that set 2 and 7.
Its save Button prints Save completed after a successful save, under Category Save Check and Type Info.
Keep those Logic attachments enabled and their owners active.
Select the intended startup Scene in Game Settings, then save the project before testing edited Logic. Stop any previous test first.
Start a Controlled Playtest
- Select Debug Play to start the example with the Debugger connected.
- Open Watch and Pause. Enter
$scorein Value or Calculation, with Use Selected Instance off. - Select Track Value. The tracked result starts at
0. - Under When a variable changes, enter
scorein Variable. - Choose Global Variable for Scope and Record a Message for Action. Select Add Change Rule.
- Activate the score
2interaction and watch its result change to2.
Track Value clears the entry field after adding the watch.
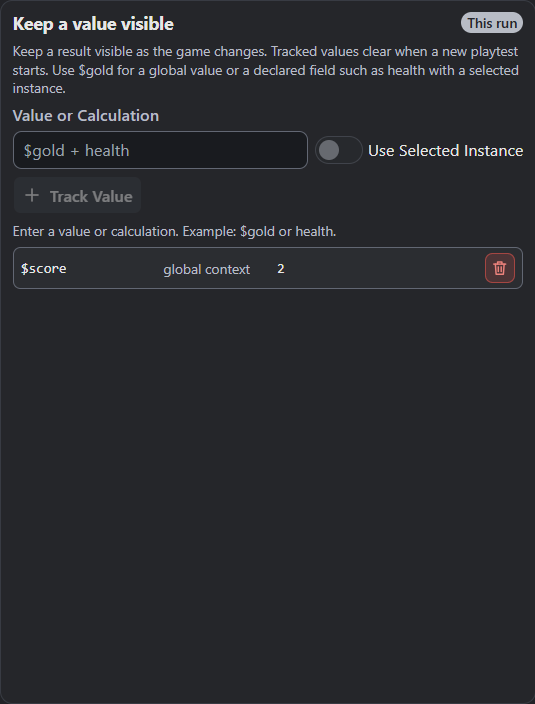
- The tracked score is 2 in global context.
$score is the watch expression. The change rule uses score.
Use the bare declaration name in that field; Console records score changing from 0 to 2.
F6 opens the Debugger without starting a game. The default F5 shortcut starts ordinary play, then pauses or resumes an existing run. Use Debug Play when testing source pause points.
Find the Completion Message
Activate the example’s save Button once, then wait for Save completed.
Open Console, type Save completed in Find Console Output, and choose Save Check in Console Category.
Leave the Info message Type enabled.
The filtered line reports the completed save. A diagnostic placed before Save Game reports the earlier trigger; check the completion message for its outcome. For another Event, place a connected Print Debugger Message at the point you want to observe. Give it a distinctive Message, Category and Type, then repeat one known interaction.
Several matching messages can mean several owners, attachments or Event implementations ran. Test one owner first. Published games ignore Print Debugger Message. Give players their feedback through a supported in-game display.
Inspect a Live Instance
Select Pause Game, then Inspect. Search Filter Scene Instances by the Object’s name or instance number, then select a listed instance. An onscreen Button caption can differ from its instance name. Clear the filter if nothing matches.
Project Globals includes score. Change its offered live-value field from 2 to 7 and commit the edit.
This changes the paused run. Continue to observe the result, or use Step Frame for one simulation frame.
Stop and start Debug Play again. The authored starting value is still 0.
Re-select a current instance after loading progress or changing Scenes, since those operations can replace instances.
Track a Value and Its Changes
Watches keep expressions visible; change rules observe named variables. For instance-owned data, select its instance in Inspect first, then enable Use Selected Instance for the watch. Enter a compatible declared field or calculation. Choose Selected Instance as a change rule’s Scope when following that owner’s variable.
Choose Pause the Game as the change rule’s Action to inspect the next change while paused. Watches and change rules clear when a new playtest starts. Add them again for that run.
Step and Configure Pause Behavior
Add a source pause point with the pause control beside an Event’s Mode or Action in its Logic canvas.
Save the project to keep it. Stop the current run, then start Debug Play and trigger that Event.
Place the pause point beside the score-setting Mode, then trigger that interaction.
Score pauses at 0.
Step Action reaches its first Action without changing the score; Step Event then finishes the Event and pauses with score 2.
Read Why the Game Paused to locate the held source.
| Control | What It Changes | When to Choose It |
|---|---|---|
| Step Action | Advances to the next supported Action boundary. | Follow a held Event one Action at a time. |
| Step Event | Finishes the held Event and pauses again. | Observe the rest of that Event together. |
| Step Frame | Advances one paused simulation frame. | Inspect a frame after an ordinary pause. |
| Continue Game | Resumes execution. | Return to normal gameplay. |
Step Action and Step Event stay disabled after an ordinary pause unless an Event context is parked.
Expand Debug Options for speed and automatic pausing. Playtest Speed ranges from 0.05× to 4×; Reset to 1× restores normal speed.
Pause When Debug Play Starts applies to the next launch, leaving the current run alone.
Pause When an Error Happens holds execution on a reported uncaught error.
Show Bounds and Movement draws a spatial overlay; Select Instances in the Game Window supports picking a live target.
If several game windows are connected, use Game Window to Inspect for inspection, edits, watches, stepping, overlays and captures. Pause and Continue coordinate the game windows. Record which window you inspected. In multiplayer, edits and steps can make the selected window diverge from its peers.
Compare Performance and Local Diagnostics
Open Performance and enable Profile Events before repeating the score interaction. If paused, select Continue Game before activating the interaction once. Event Activity lists its owner and Logic. The owner can appear as a Scene-local identity rather than the Button’s caption. Read Live Metrics alongside the measured Event time.
Capture Next Frame, or Capture Paused Frame while held, requests a rendered frame. Read Frame Capture after the response arrives. If no draw calls were recorded, follow its visible-rendering guidance before comparing costs. A five-second timeout reports that no frame arrived; follow its guidance before trying again. Use Set Baseline to retain a timing comparison, Remove Baseline to discard it, and Clear Performance Results to clear current results. Keep the Scene, speed, inputs and capture timing consistent. Measure published-game performance on the intended devices too.
In Diagnostics, turn on Debug Logging and the categories needed before reproducing the issue. The categories are Rendering, Lifecycle, Assets, Services and Performance. Show filters events already collected. Inspect Live Rendering Resources and Local Events. Clear Events clears that local log; authored Console messages keep their separate buffer.
Troubleshooting
| Symptom | Check | Next Action |
|---|---|---|
| No matching message | Window, filters, Event and enabled owner. | Clear filters and isolate one connected diagnostic. |
| Watch has no value | Declaration or scope mismatch. | Check the name; instance-owned data also needs the right selected instance. |
| Live editing is unavailable | Connection, pause state and supported field. | Pause the connected target before editing. |
| Step Action is disabled | Whether an Event is parked. | Trigger a source pause point, or use Step Frame. |
| Diagnostics is empty | Collection was off. | Turn on Debug Logging and the needed category before repeating the editor or service operation. |
| Run or export reports invalid Logic | Named resource, Parameter or binding. | Repair that authoring diagnostic, then retry. |
Record a Reproducible Result
Keep the engine version, edition, target, Scene and initial score with the result.
Record the actual change message for 0 → 2, followed by the completed save’s Save completed message.
Include the selected window, expected outcome and first failure.
Repeat relevant boundary cases: empty text, zero, repeated input, destroyed targets or missing optional bindings.
Console keeps at most 500 entries. Save useful output before frequent logging displaces it. Copy Visible uses the current filters; Copy All and Save Output use the selected window’s entire buffered output. Check the copy notification for success or refusal; Clear Console clears messages and retains the current run state.
Where to Look Next
Use Debugging Actions for exact diagnostic fields and defaults. Saving and Loading Progress explains the example’s completion Events and storage checks. Weighted Maze’s A Step Pauses First uses the game’s own pause and step Custom Events. Those game interactions are separate from Debugger stepping. After publishing, check the actual output’s hosting, assets, storage and services. Keep a minimal project and exact diagnostic text for an issue sent through support channels.
Myth Engine Documentation